Pedigree Statistics
TrueNicks uses a number of coefficients to explain the relationships that are formed beyond those seen in a five generation pedigree. All coefficients are calculated to 10 generations. The reason is twofold. Firstly, the variation in inbreeding and ancestry in Thoroughbreds beyond 10 generations is very similar with very little effect on the coefficient calculation. Secondly, the computational requirement beyond 10 generations begins to be significant; thus, to compute the calculation for a single horse starts to become both time and computationally sensitive, which we need to be mindful of when serving up the TrueNicks reports. With these two considerations in mind, we believe that the calculation of the metrics below to 10 generations is sufficient.
Inbreeding Coefficient (IC) measures the Inbreeding to 10 generations using Sewall Wright's F calculation expressed as a percentage value. A low inbreeding coefficient means a low level of inbreeding. The vast majority of Thoroughbreds will have an inbreeding coefficient of less than 10% and inbreeding coefficients over 15% are very rare.
Wright, who was interested in improvement in cattle, was thinking of two consequences that matter to a breeder in relation to inbreeding, one consequence being positive, that of uniformity and prepotency, and one being negative, that of loss of vigor and fertility. Wright thought that it would be useful to be able to calculate the degree of inbreeding of an animal because it would make these effects more predictable. His thinking at the time - and applying it to cattle - was that this was important because these two effects were at odds with each other; breeders could increase predictability and uniformity by inbreeding, presumably to superior ancestors, but not without also having detrimental effects on an animal’s health and fertility.
There are some deficits to Wright's F that we had to create a work around on to compensate for in applying it to Thoroughbreds. Firstly, the equation considers duplicated ancestors only if they are common to both sire and dam, so if you have a sire that is inbred and a dam that is not inbred to the same ancestors, the inbreeding coefficient as proposed by Wright will underestimate the level of inbreeding for that individual. Secondly, Wright's F equation considers inbred ancestors only if they are duplicated ancestors. So, if you take a stallion like Danehill, who is inbred to Natalma 3x3, he would not have an effect on the calculation of the IC, unless he himself was duplicated. Again, this will underestimate the level of inbreeding. To resolve both these issues, we calculated the IC of each ancestor in the pedigree to 10 generations, find each pair of common ancestors and count the number of generations between them, then sum together values for all pairs of common ancestors.
Inbreeding reduces the amount of genetic diversity in a population. As inbreeding increases, the frequency of DNA being homozygous at a particular point on a chromosome also increases. Hence inbreeding reduces the amount of variation in a population. At an individual level, inbreeding leads to more consistent, predictable inheritance of traits from the immediate ancestors. Too much inbreeding, however, can result in deleterious effects that are being carried in the ancestry, and have an influence on the race performance of the resultant foal.
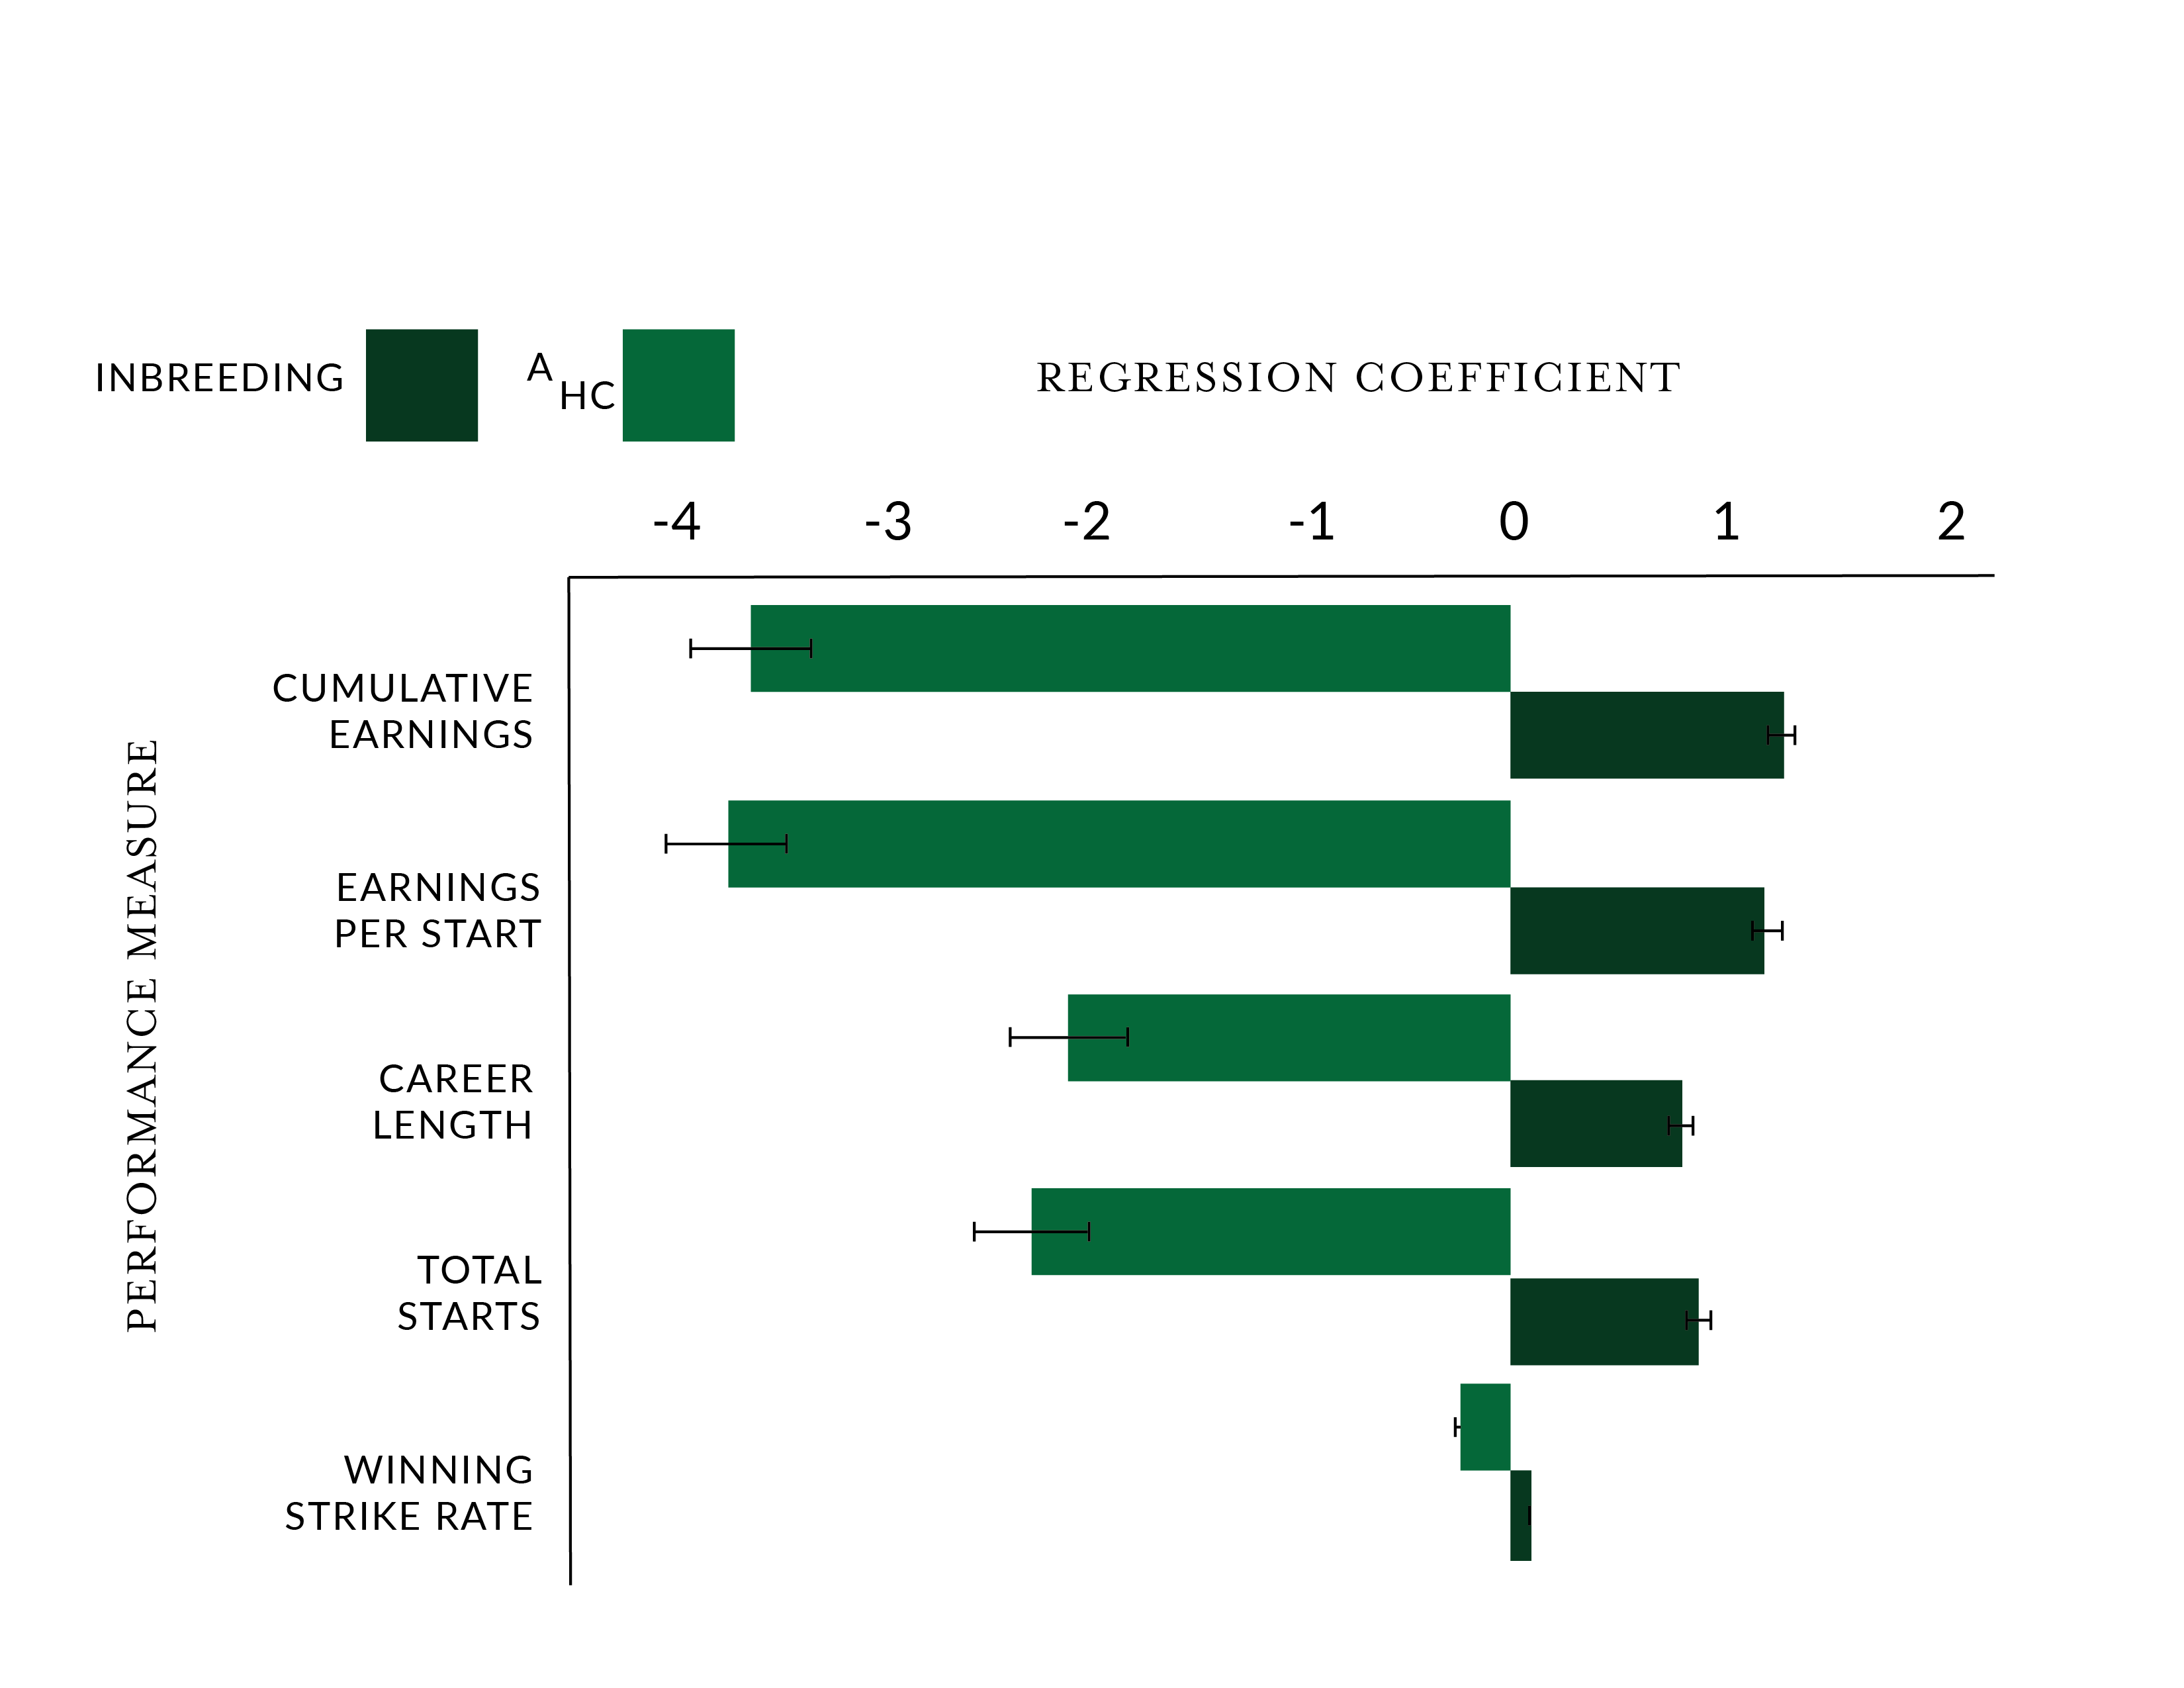
In a 2018 peer reviewed paper titled “Founder-specific inbreeding depression affects racing performance in Thoroughbred horses," the analysis of data from more than 135,000 Thoroughbreds racing in Australia from 2000 and 2010 showed that inbreeding has failed to “alleviate the genetic load” in the breed. This genetic load of partially deleterious effects is still being carried by the population and is more likely to manifest itself with inbreeding. Thus, higher levels of inbreeding have a potentially negative effect on race performance. From that paper we have reproduced their findings on the relationship between inbreeding, as represented by the inbreeding coefficient and five metrics for performance. You can see that Inbreeding has an effect on these performance metrics
So what is an optimal level of inbreeding?
The TrueNicks Inbreeding Coefficient is calculated to 10 generations. Using The Jockey Club database we calculated the Inbreeding Coefficients for all the horses that were catalogued in the following yearling sales and attached their known racing outcome to them:
- 2015 Magic Millions January - Australia
- 2015 Emperors Palace Sale – South Africa
- 2015 JRA July - Japan
- 2015 Baden Baden – Germany
- 2015 Keeneland September - USA
- 2015 Tatts October (1-3) – England
- 2015 Arqana October – France
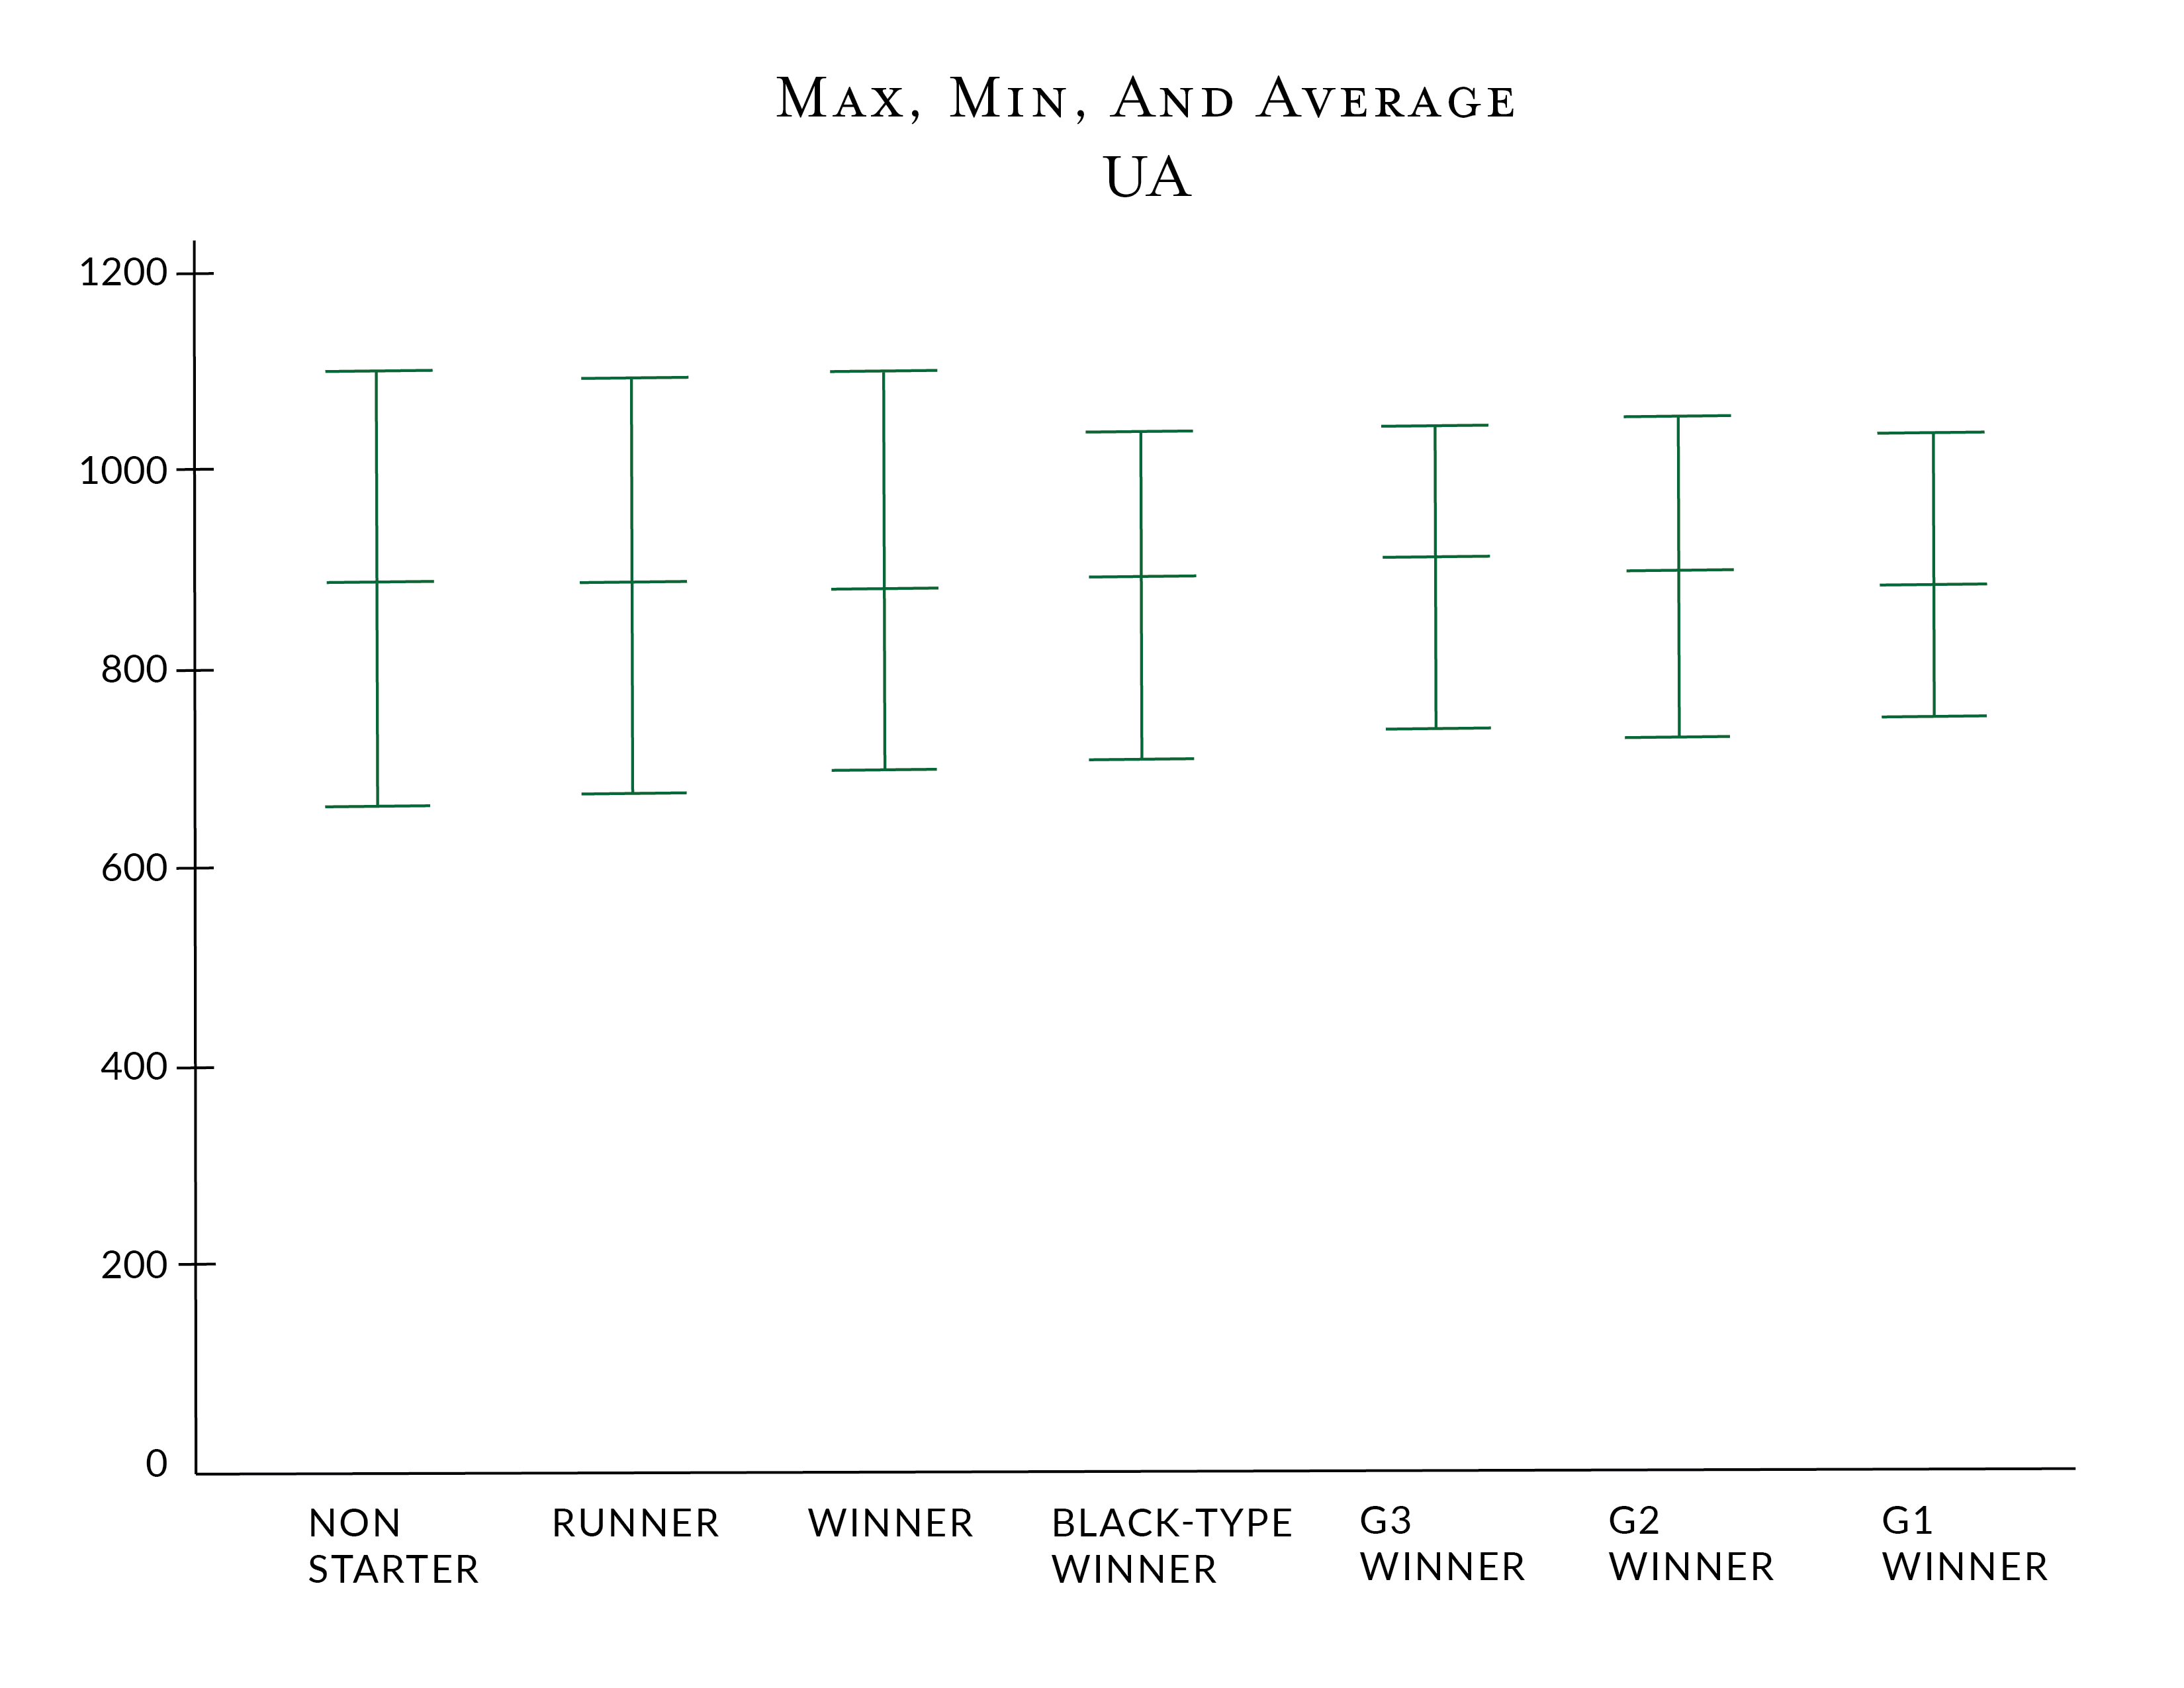
The following statistics were derived from the data:
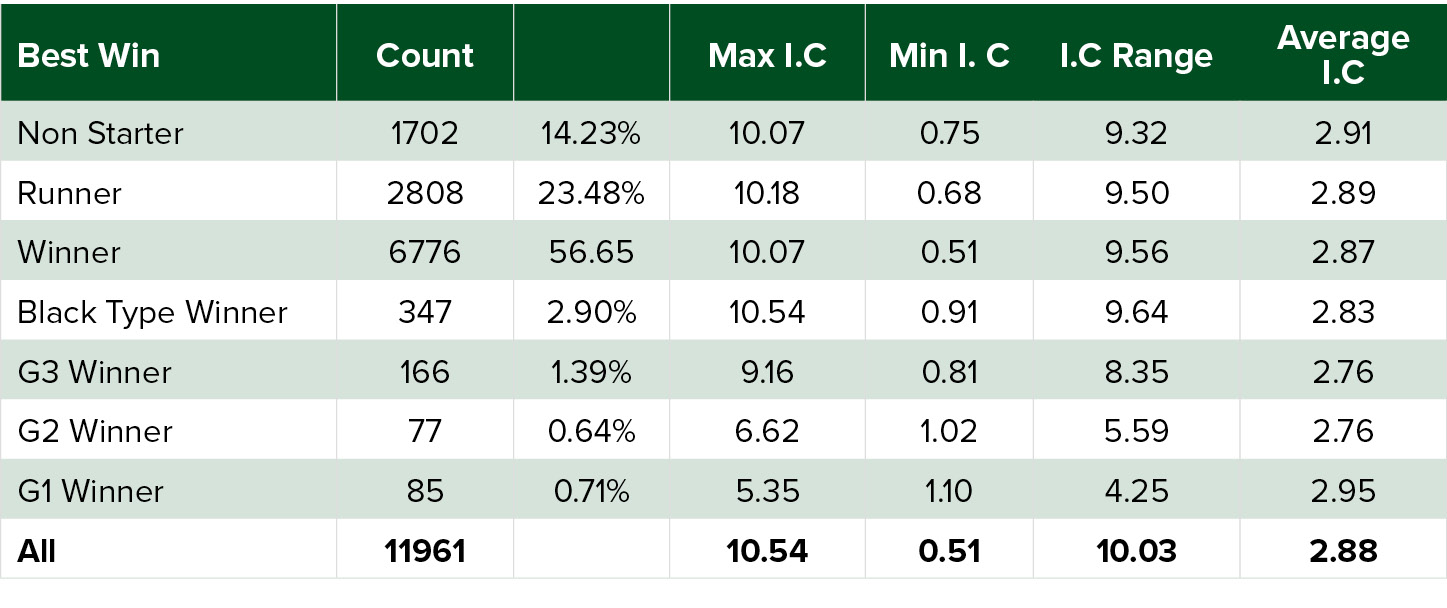
From the above statistics it is possible to see that the same effect of inbreeding that was found in the paper by Todd, et al. above, is found here. That is, the higher the Maximal Inbreeding Coefficient, the lower the percentage chance that the foal is a Group or Grade 1 winner. You will also notice the smaller ‘range’ of inbreeding coefficients that the G1 winners from these sales fall within. They are somewhat inbred, with a minimum Inbreeding Coefficient above 1.0, but not too inbred, with a maximum Inbreeding Coefficient of 5.35. As this population is taken across commercial yearlings that are being sold at major yearling sales throughout the world, it is reasonable to conclude that these statistics will act as a good guide to how to use inbreeding.
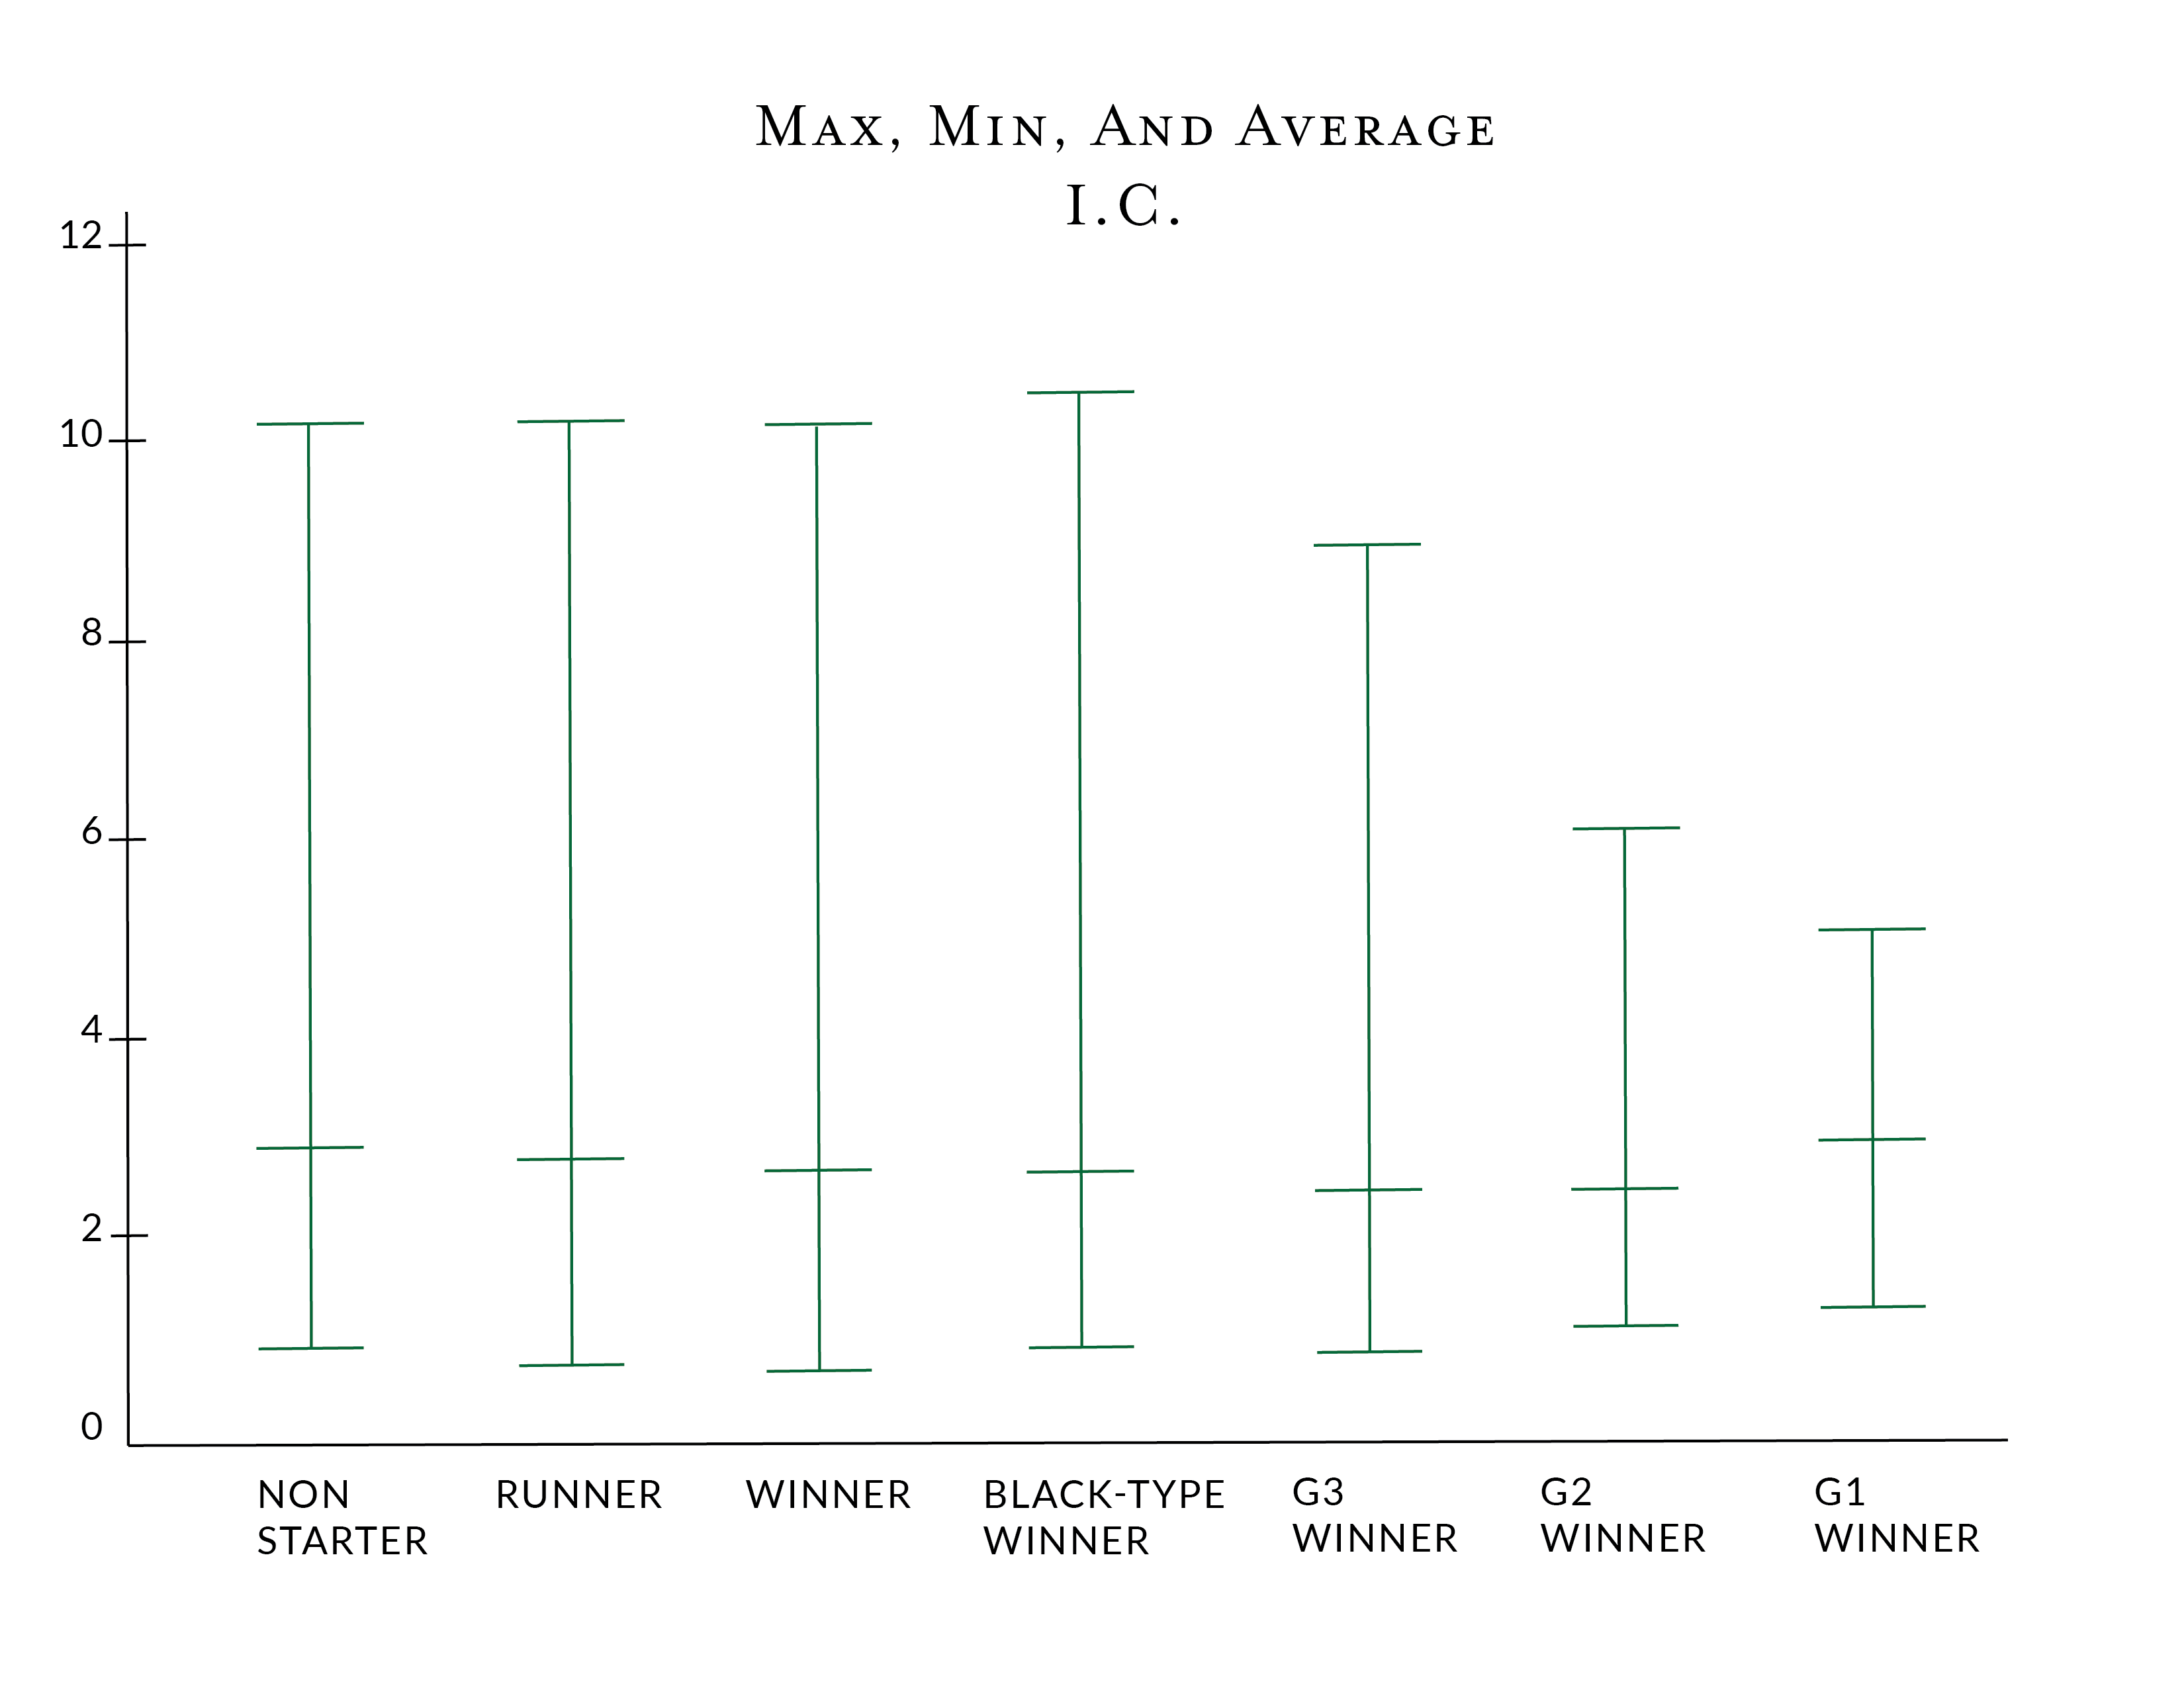
For those that prefer a visual representation of the same data, the image below shows the differences in the Inbreeding Coefficients. It is worth noting that "Runner" means a horse that has raced, but did not win, probably the best metric for a lack of performance, where "Non-Starter" reflects a horse that has failed to start in a race, which can occur for a variety of reasons.
Coefficient of Relationship (COR) measures the degree of consanguinity, or biological relationship, between two individuals. The term Coefficient of Relationship (COR) was, like the Coefficient of Inbreeding, defined by Sewall Wright in 1922. The IC of an individual is approximately half the relationship between the two parents. So, in practical terms the IC, should be half the value of the COR. However, this equivalence only applies to low levels of inbreeding in an otherwise outbred population. e.g. Two single first cousins normally have a relationship of 1/8 (12.5%). If there has been no previous inbreeding, their children will have a coefficient of inbreeding of 1/16 (6.25%).
With higher levels of inbreeding, like that found in the Thoroughbred, this relationship between the IC and COR breaks down. As an example of this, when we consider a horse who has an inbred sire, like say Danehill, but his dam is inbred herself but an outcross to the ancestors found within Danehill, the relationship between the inbreeding coefficient of the horse and the coefficient of relatedness of its parents is particularly stark.
Ancestral History Coefficient (AHC) is derived from a Monte-Carlo simulation of pedigree data that counts the number of times that an allele has potentially been identical by descent in an individual’s pedigree, thus providing a comprehensive reflection of selection for favorable ancestors/traits over time. The basis of the Ancestral History Coefficient was first proposed by MacCluer, et al. where they considered a "Gene Dropping" simulation procedure of pedigree data in which unique numbers are assigned to each founder, and a genotype is created for each descendant by Mendelian segregation of parental alleles. Thus, if a distant ancestor appearing on both sides of the pedigree (sire and dam) has the same number applied to it, and that number 'survives' each coin-flip for inheritance at each generation, and if the two meet at the sire and dam position, it is considered an identical-by-descent event. By performing the simulation a number of times - in our case 100,000 - we are able to calculate the number of Identical-by-descent events that occur in the pedigree.
The AHC was refined in the paper from Baumung and his colleagues in “GRAIN: a computer program to calculate ancestral and partial inbreeding coefficients using a gene-dropping approach” that was published in the Journal of Animal Breeding and Genetics in 2015 and is the basis of the calculation that we use. The underlying concept behind the AHC is the understanding that ancestors that have experienced more inbreeding in the past are less likely to be deleterious to performance and health than those ancestors that have undergone inbreeding less often. Another way of thinking about the AHC is to think about what we do as an industry when we are making decisions about how we are breeding. When a stallion is considered a great sire, for example Sadler’s Wells, we generally select his best sons, to retire to stud in the belief that the genes of this great sire will be passed on to his best sons. At each generation, however, we are making a decision in selecting what we believe is worthy of breeding to. So, when a son of Sadler’s Wells like Entrepreneur, a good racehorse but a thoroughly disappointing sire, proves that he is not ‘passing on’ his genetics, we select heavily away from him. We do this by not only discontinuing to use him as a stallion, but we heavily select against his sons and daughters at stud. Thus, within a relatively quick time period, the name of Entrepreneur, and his alleles/ancestors that appear in his pedigree, drop out of the genetic pool of alleles/ancestors that are in the breed. Conversely, when a son of Sadler’s Wells like Galileo comes along who proves not only a top-class racehorse but an elite stallion who is 'passing on' his genetics, we select toward him. We stand his best sons at stud, and keep his daughters, even those that proved less than athletic on the racetrack. As we do this process of selecting for and against both stallions and mares, including female families that come in and out of ‘fashion’, we are continually selecting toward parents and ancestors with positive association to performance.
In contrast to Wright's F inbreeding coefficient, the ancestral history coefficient, AHC, shows a strong positive association with racing performance. This was also the finding that Todd, et al. found in their larger study (with reference to the regression image above). In reverse to the IC, the Group/Grade 1 winners have higher AHC scores (they have lower IC scores), but they appear across a narrower "range" of scores in both the AHC and IC.
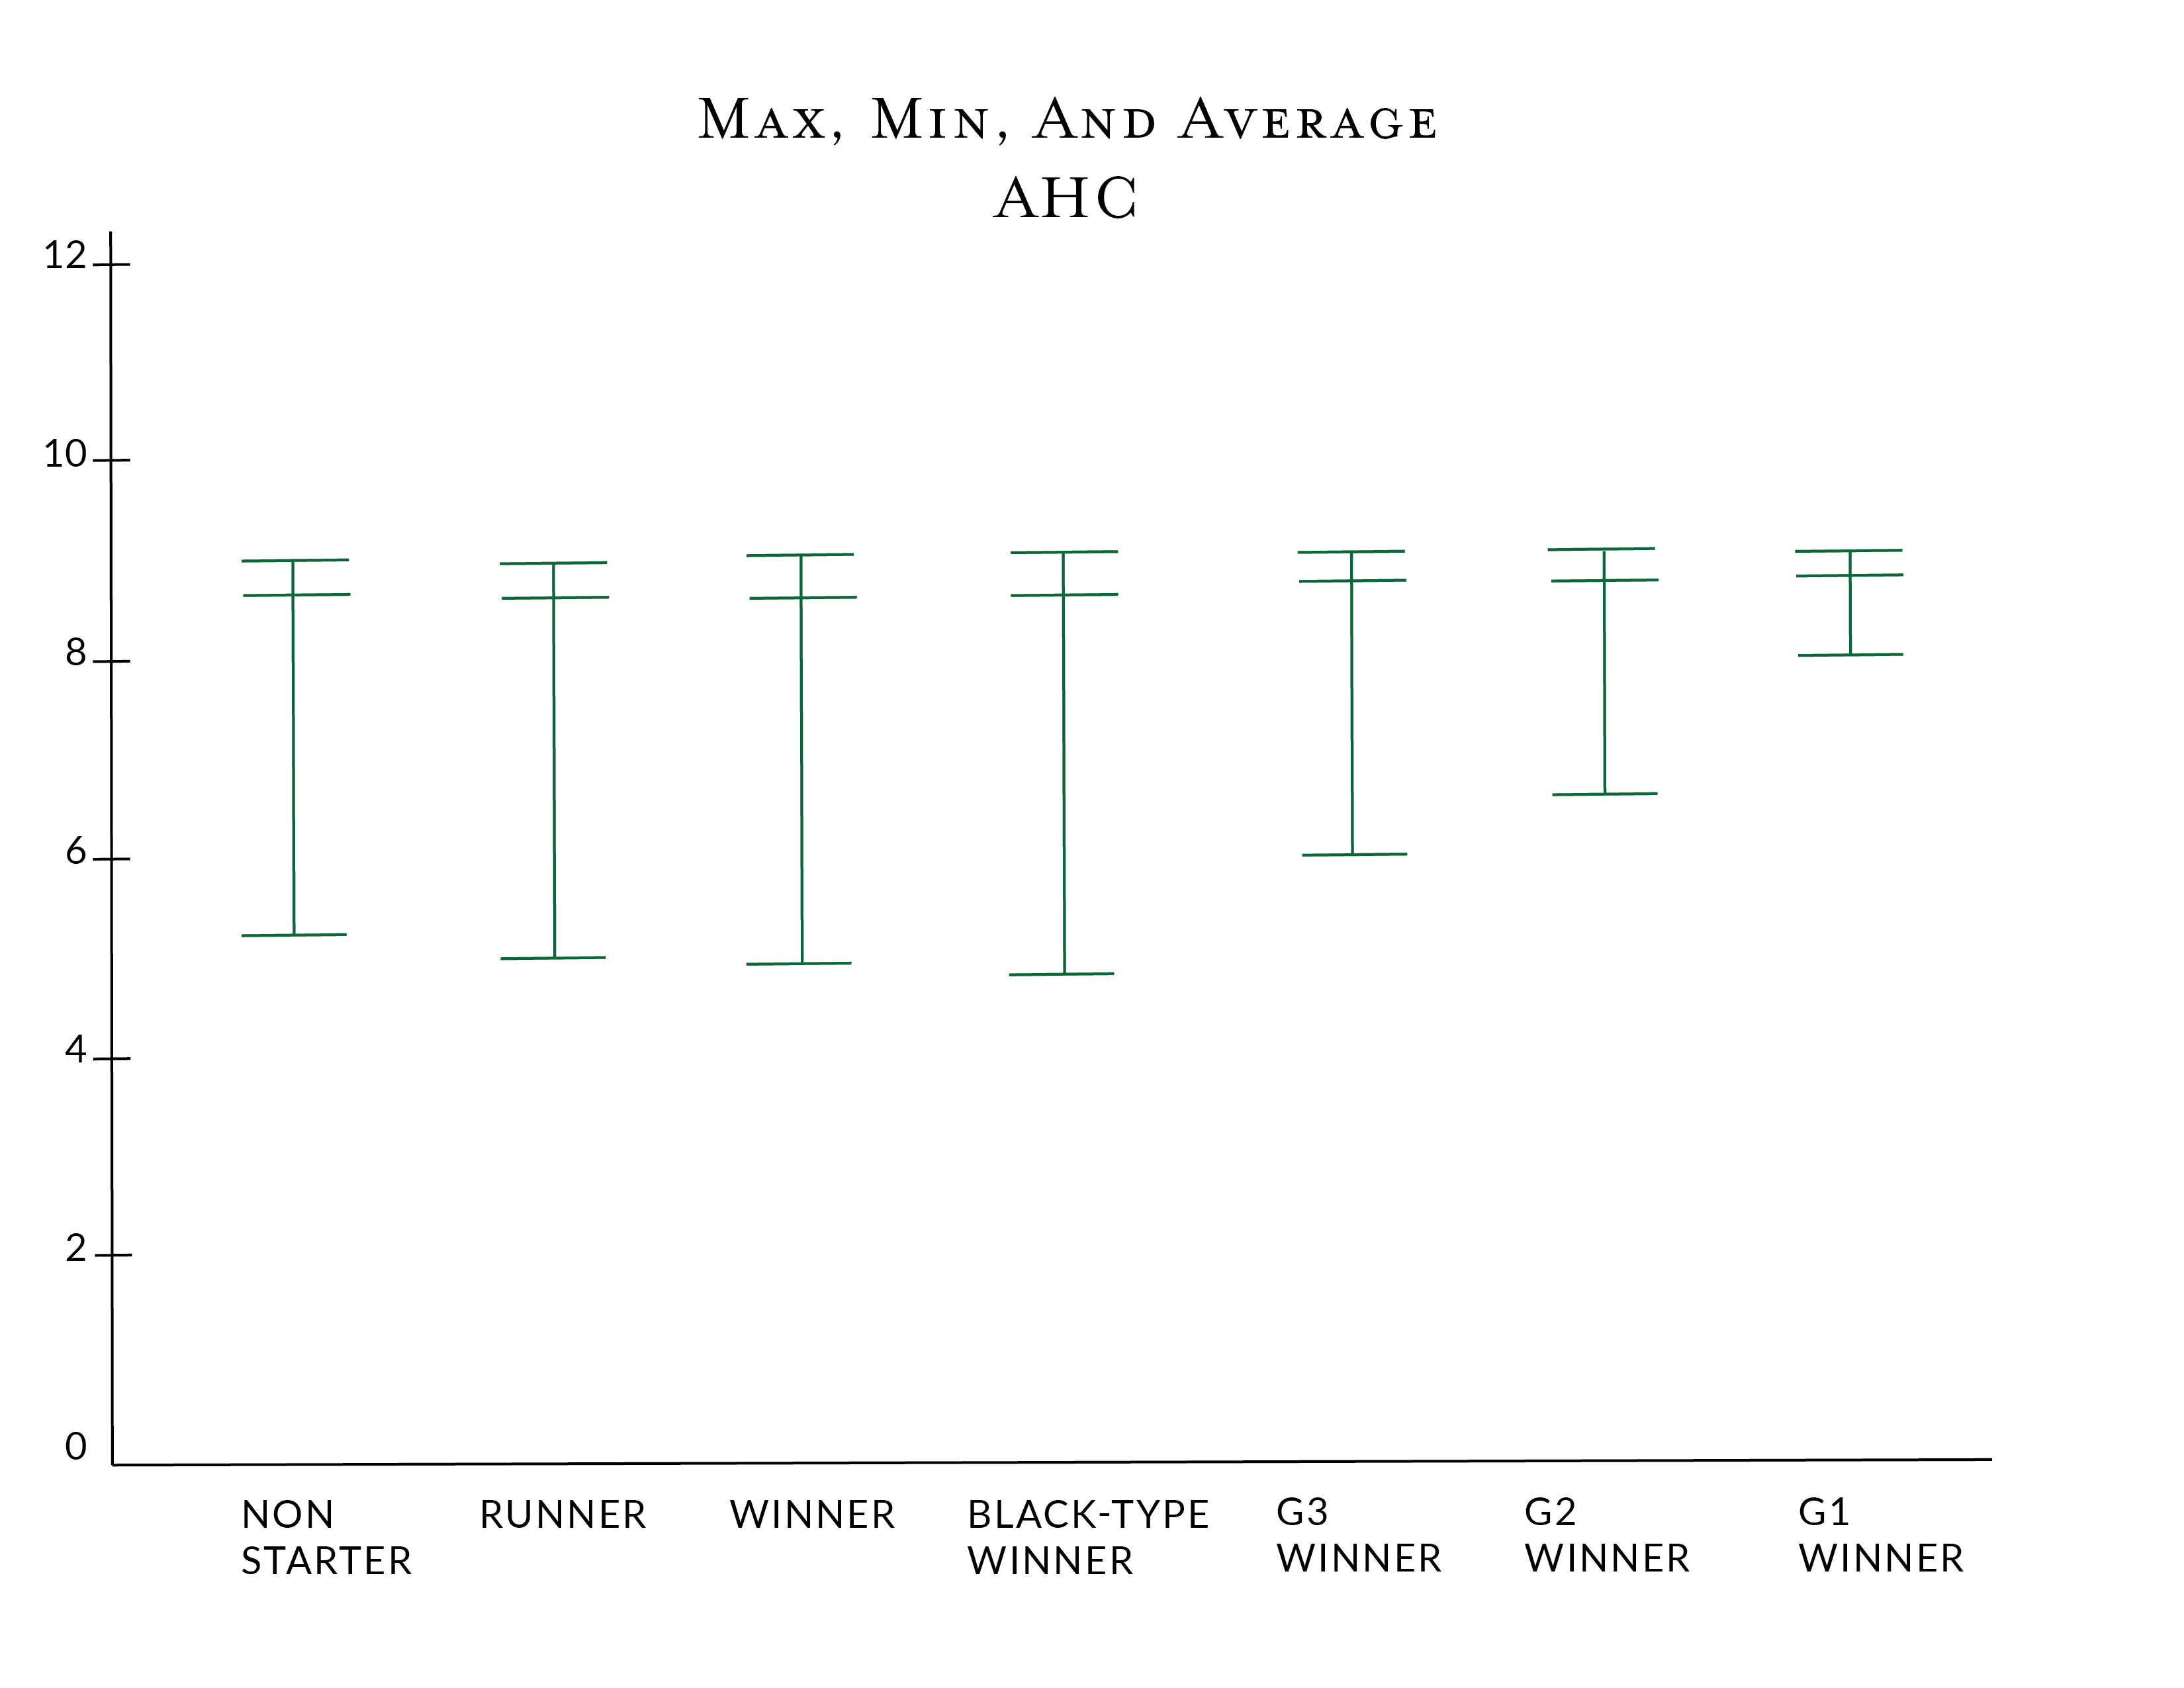
There is a strong inverse correlation between the IC and AHC and performance. Horses with better performance levels tend to have higher minimum AHC scores and lower maximum IC scores, while horses with lesser performance tend to have the reverse.
Pedigree Completeness is the portion of the pedigree that is on file to 10 generations. As the Jockey Club database only includes data from the General Stud Book, or where pedigree has been verified by a stud book associated with the ISBC, from time to time there is a distant ancestor where the pedigree cannot be verified and is therefore missing. Most modern horses have 100% Pedigree Completeness to 10 generations.
Unique Ancestors is the number of Unique Ancestors found to 10 generations in the pedigree. Similar to the IC and AHC, there might be optimal ranges for superior runners to be bred within. Using the same data above, we find the following
The lower number of maximal and average unique ancestors seems counter to the data that show a high level of inbreeding is deleterious. However, the Unique Ancestors in the superior horses tend to be more evenly spread across the pedigree and at a greater depth; therefore, while a lower number of ancestors is being used, the effect of inbreeding isn't as pronounced.